From our archive. This post was published in October 2023, and some details may have changed since.
Building on our July Prime Day Recap, we’re checking in with five noteworthy takeaways from this year’s October Prime Big Deal Days (PBDD) event.
1. Amazon leaned further into commerce content via aboutamazon.com…
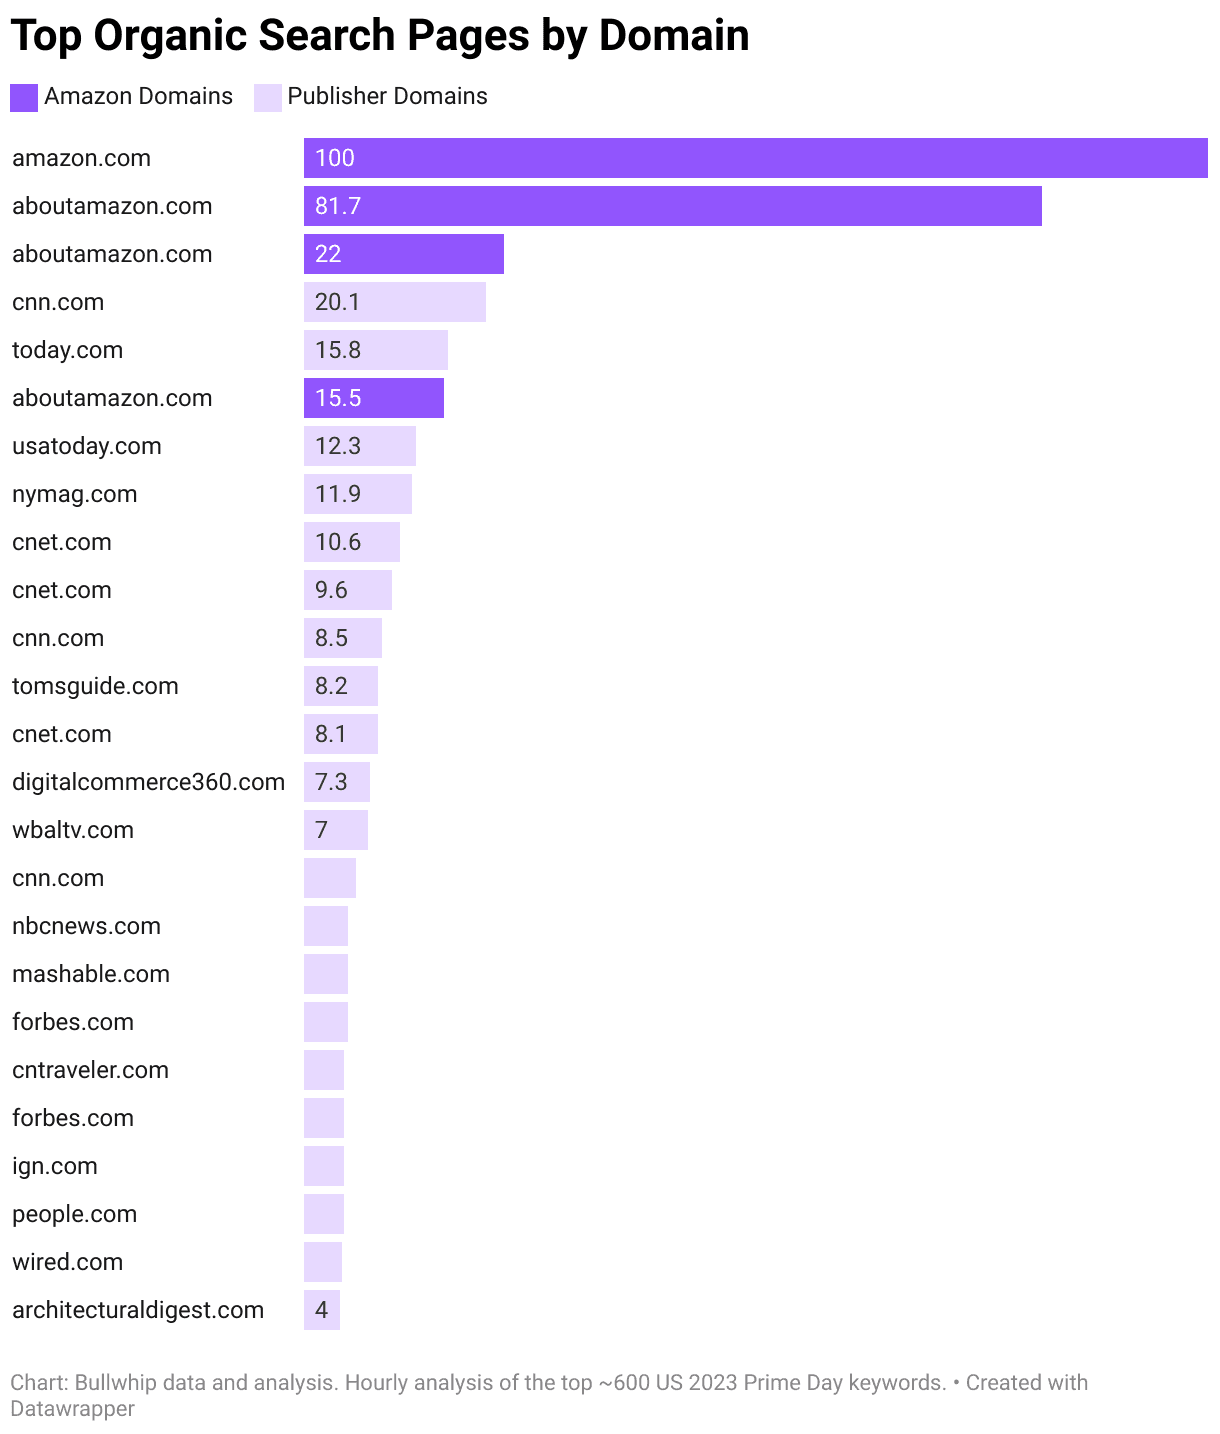
As was the case in July, Amazon.com benefitted from the most widely SEO-distributed link (https://www.amazon.com/primebigdealdays (opens in a new tab)), its landing page for the 2-day event.
Distinct from July, however, was the strong performance of the aboutamazon.com (opens in a new tab) domain, with three distinct pages performing toward the top of our visibility index:
- About Amazon’s Prime Day landing page (opens in a new tab), which prominently featured their Live Blog coverage of the two-day event
- A basic explainer page (opens in a new tab) covering how to find the best deals and make the most of PBDD
- A similar announcement page (opens in a new tab) which, like the prior page, likely benefitted from the large number of general queries regarding the date and times of the 2-day shopping event.
Want to dive further into the data? Check out the rank and index of the top performance pages in this Airtable (opens in a new tab).
2. …meaningfully impacting overall SEO share of voice
While data on aggregate traffic for October (vs. July) is still coming in, this out-performance of aboutamazon.com did appear to contribute to a material share gain for Amazon’s own domains, vs. 3rd party pages with editorial perspectives on the best deals and opportunities.
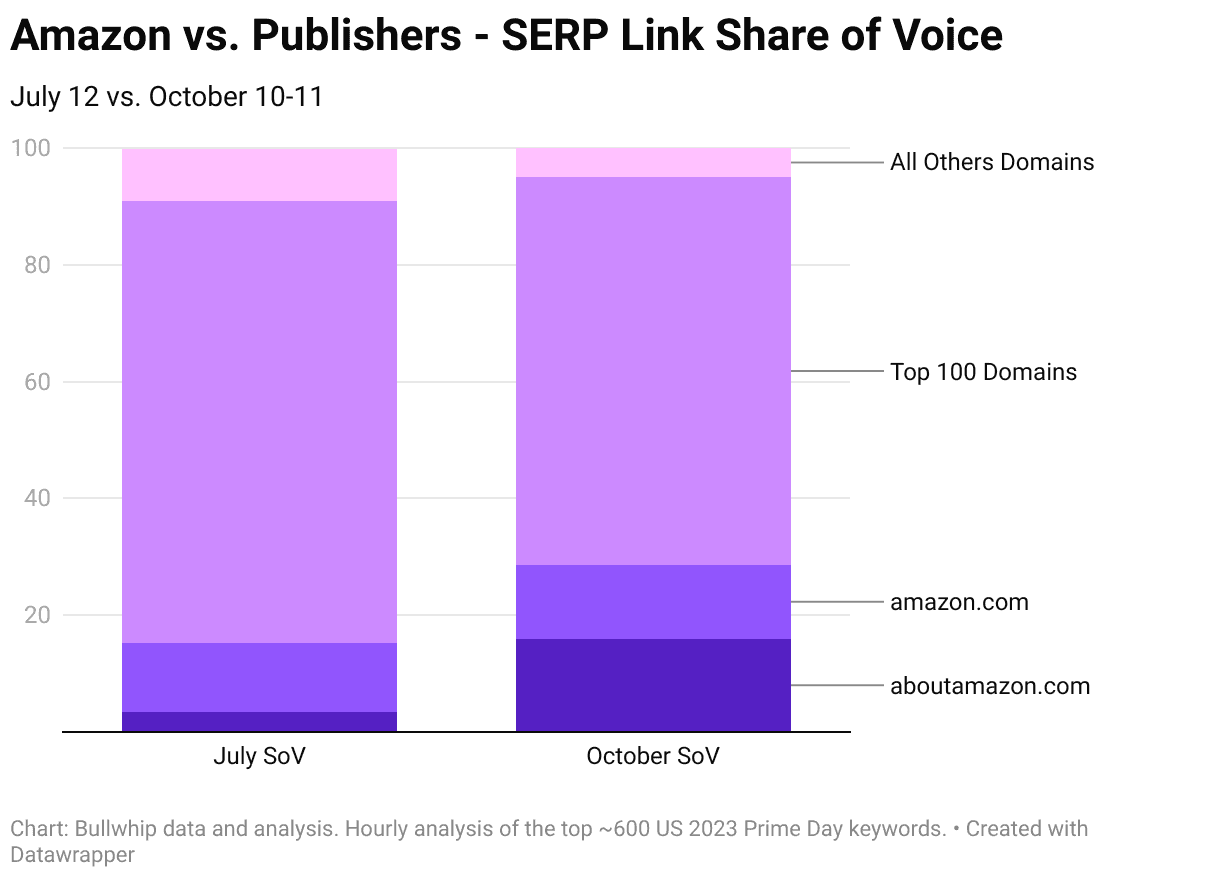
Our calculation of share of voice reflects the popularity over various search terms (spanning ~600 top terms related to Prime Day / PBDD), weighted by each pages hourly position on those SERPs. Therefore, these results could at least in part reflect a changing distribution of search interest in basic “informational” terms like “when is Prime Day” vs. the shopping advice and deals terms that are more likely to drive to publishers’ and creators’ commerce content pages.
3. Maintaining a top search rank is not as hard as getting it
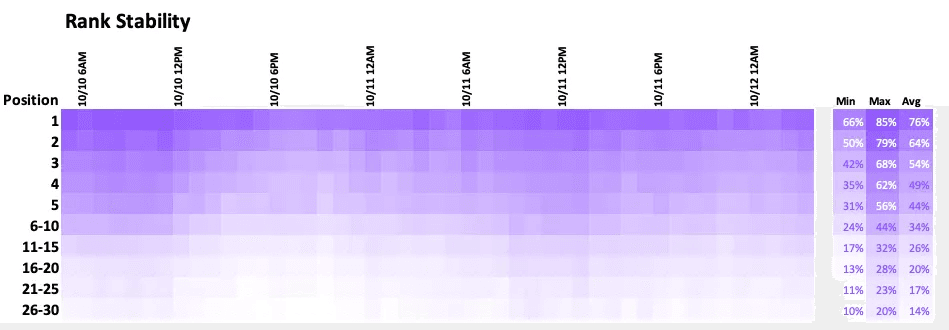
One factor we analyzed during PBDD is Rank Stability, the likelihood that a given result will maintain its search rank position for a given term over any given hour of the day. Averaging this over all ~600 analyzed keywords and hourly results during the two-day event yielded the below “heat map.”
Two points stand out here:
- Maintaining top search rank is not as hard as getting it: the likelihood of keeping the #1 top search position across any two hours is 76% on average, but this drops precipitously to just 44% for the 5th position. In other words, Google is actively experimenting more with resorting results the further you go down the page.
- The evening hours see more volatility (movement across rank positions) than the morning or early afternoon hours. There is a clear “wave” pattern of darker purple in the above chart, peaking somewhere between 6am and noon each day, with more volatility (lighter boxes) following it (Note: both the source of this search data and the times above are EDT). This could be driven by Google (changing more as late afternoon evening browsing / shopping volume picks up), publishers (providing Google with more fresh content to compete for rank during business hours) or some combination of the two.
The challenge of achieving a top rank points to the importance of preparatory work done in the days and weeks leading up to key events like PBDD.
4. Top Stories performance was led by an increasingly diverse set of publications
A broader range of publications appeared in Google’s “Top Stories” module. More specifically, we noticed more news media (i.e. versus magazine media brands) including national news domains like cbsnews.com (opens in a new tab) and nbcnews.com (opens in a new tab), as well as local newspaper domains including delawarelocal.com (opens in a new tab) and syracuse.com (opens in a new tab) covering the event and getting distribution via Google’s Top Stories.
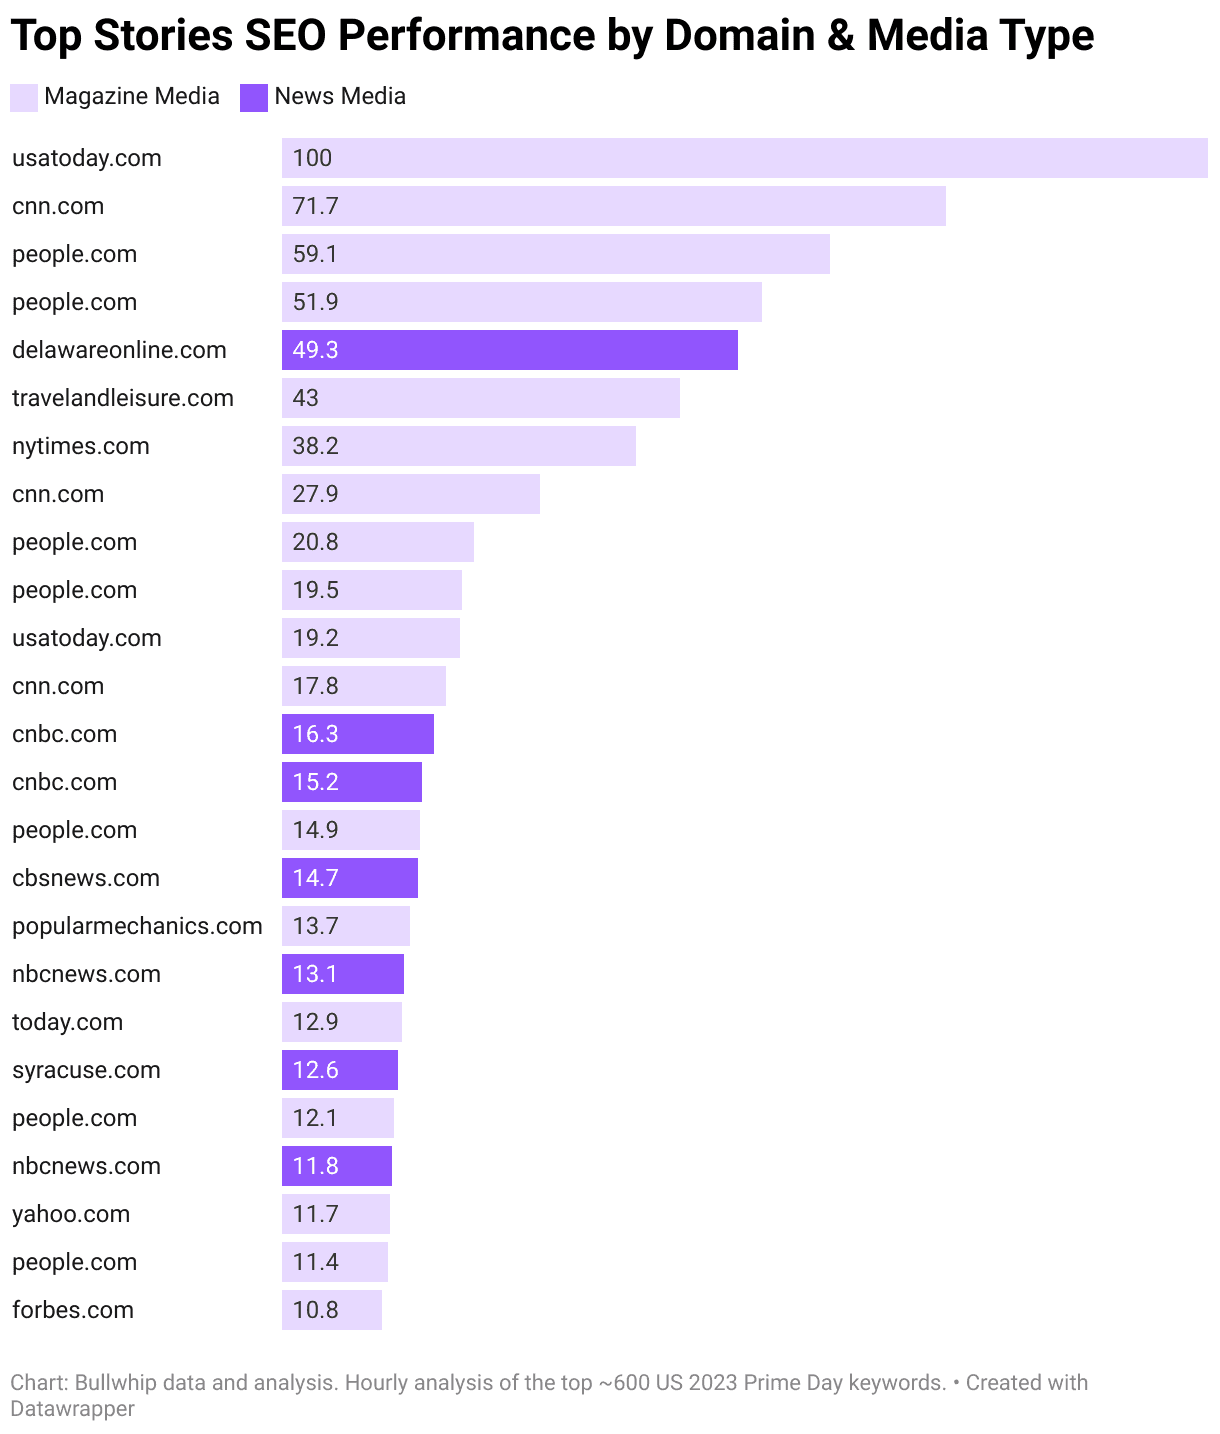
Check out the dataset here (opens in a new tab) if you’d like to explore further.
5. The top 3 Top Stories positions strongly favor recently-published content
Not surprisingly, the Top Stories module has a strong preference for recency in determining what will show up first.
Interestingly, this also varies significantly during the day. Consistent with the finding above that Organic Results are more stable in the morning / midday than later in the day, Top Stories tend to show the shortest “time since published” dates after 6pm. This was evident across all of the top 3 positions and in both the first and second days of the event.
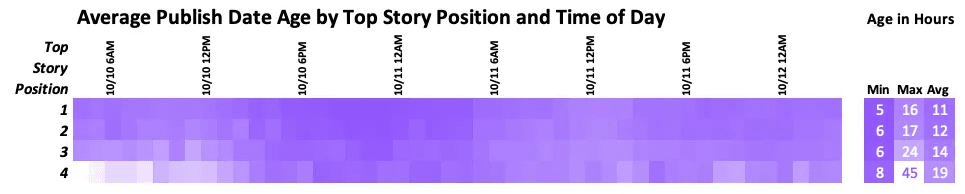
The most intense hours saw an average story age (across the ~600 keywords analyzed) of just ~5–6 hours, whereas the least intense hours saw an average as high as ~16 hours. Generally speaking, for publishers aiming to target Top Stories distribution via search should consider an update frequency of 2–4 times per day, as more frequent updates are unlikely to yield a material change in distribution.
Thanks for reading! All of the above analysis is based 100% on public information sources. Please reach out to us at partner@bullwhip.io with any questions, or if you’d like to learn more about the Bullwhip platform and how it helps leading commerce content publishers and creators grow and outperform.
P.S. Noticeably absent, admittedly, from our coverage of this fall’s event is the “elephant in the room” of the net effect of OpenAI, Bard and SGE on Prime Day SEO-driven traffic results. This is due to the lack of a representative data source on this impact to date. If you are interested in learning more about the industry-level impact of these trends, or even contributing via anonymized benchmarking, please get in touch!